Adding Charts to Dashboards with Assistant
Last updated: November 17, 2026
You can ask Assistant to build a chart and add it straight to a dashboard. Describe what you want to see in plain language, and Assistant creates the chart from your contract data, so you don’t have to build it by hand.
How it works
Tell Assistant which chart you want and which dashboard it belongs on. Assistant builds the chart and adds it to that dashboard.
Your prompt must include the word “add”. If you only describe a chart, Assistant shows you a preview and does not put it on the dashboard.
Add a chart to the dashboard you have open
Open the dashboard you want to add to.
Open Assistant.
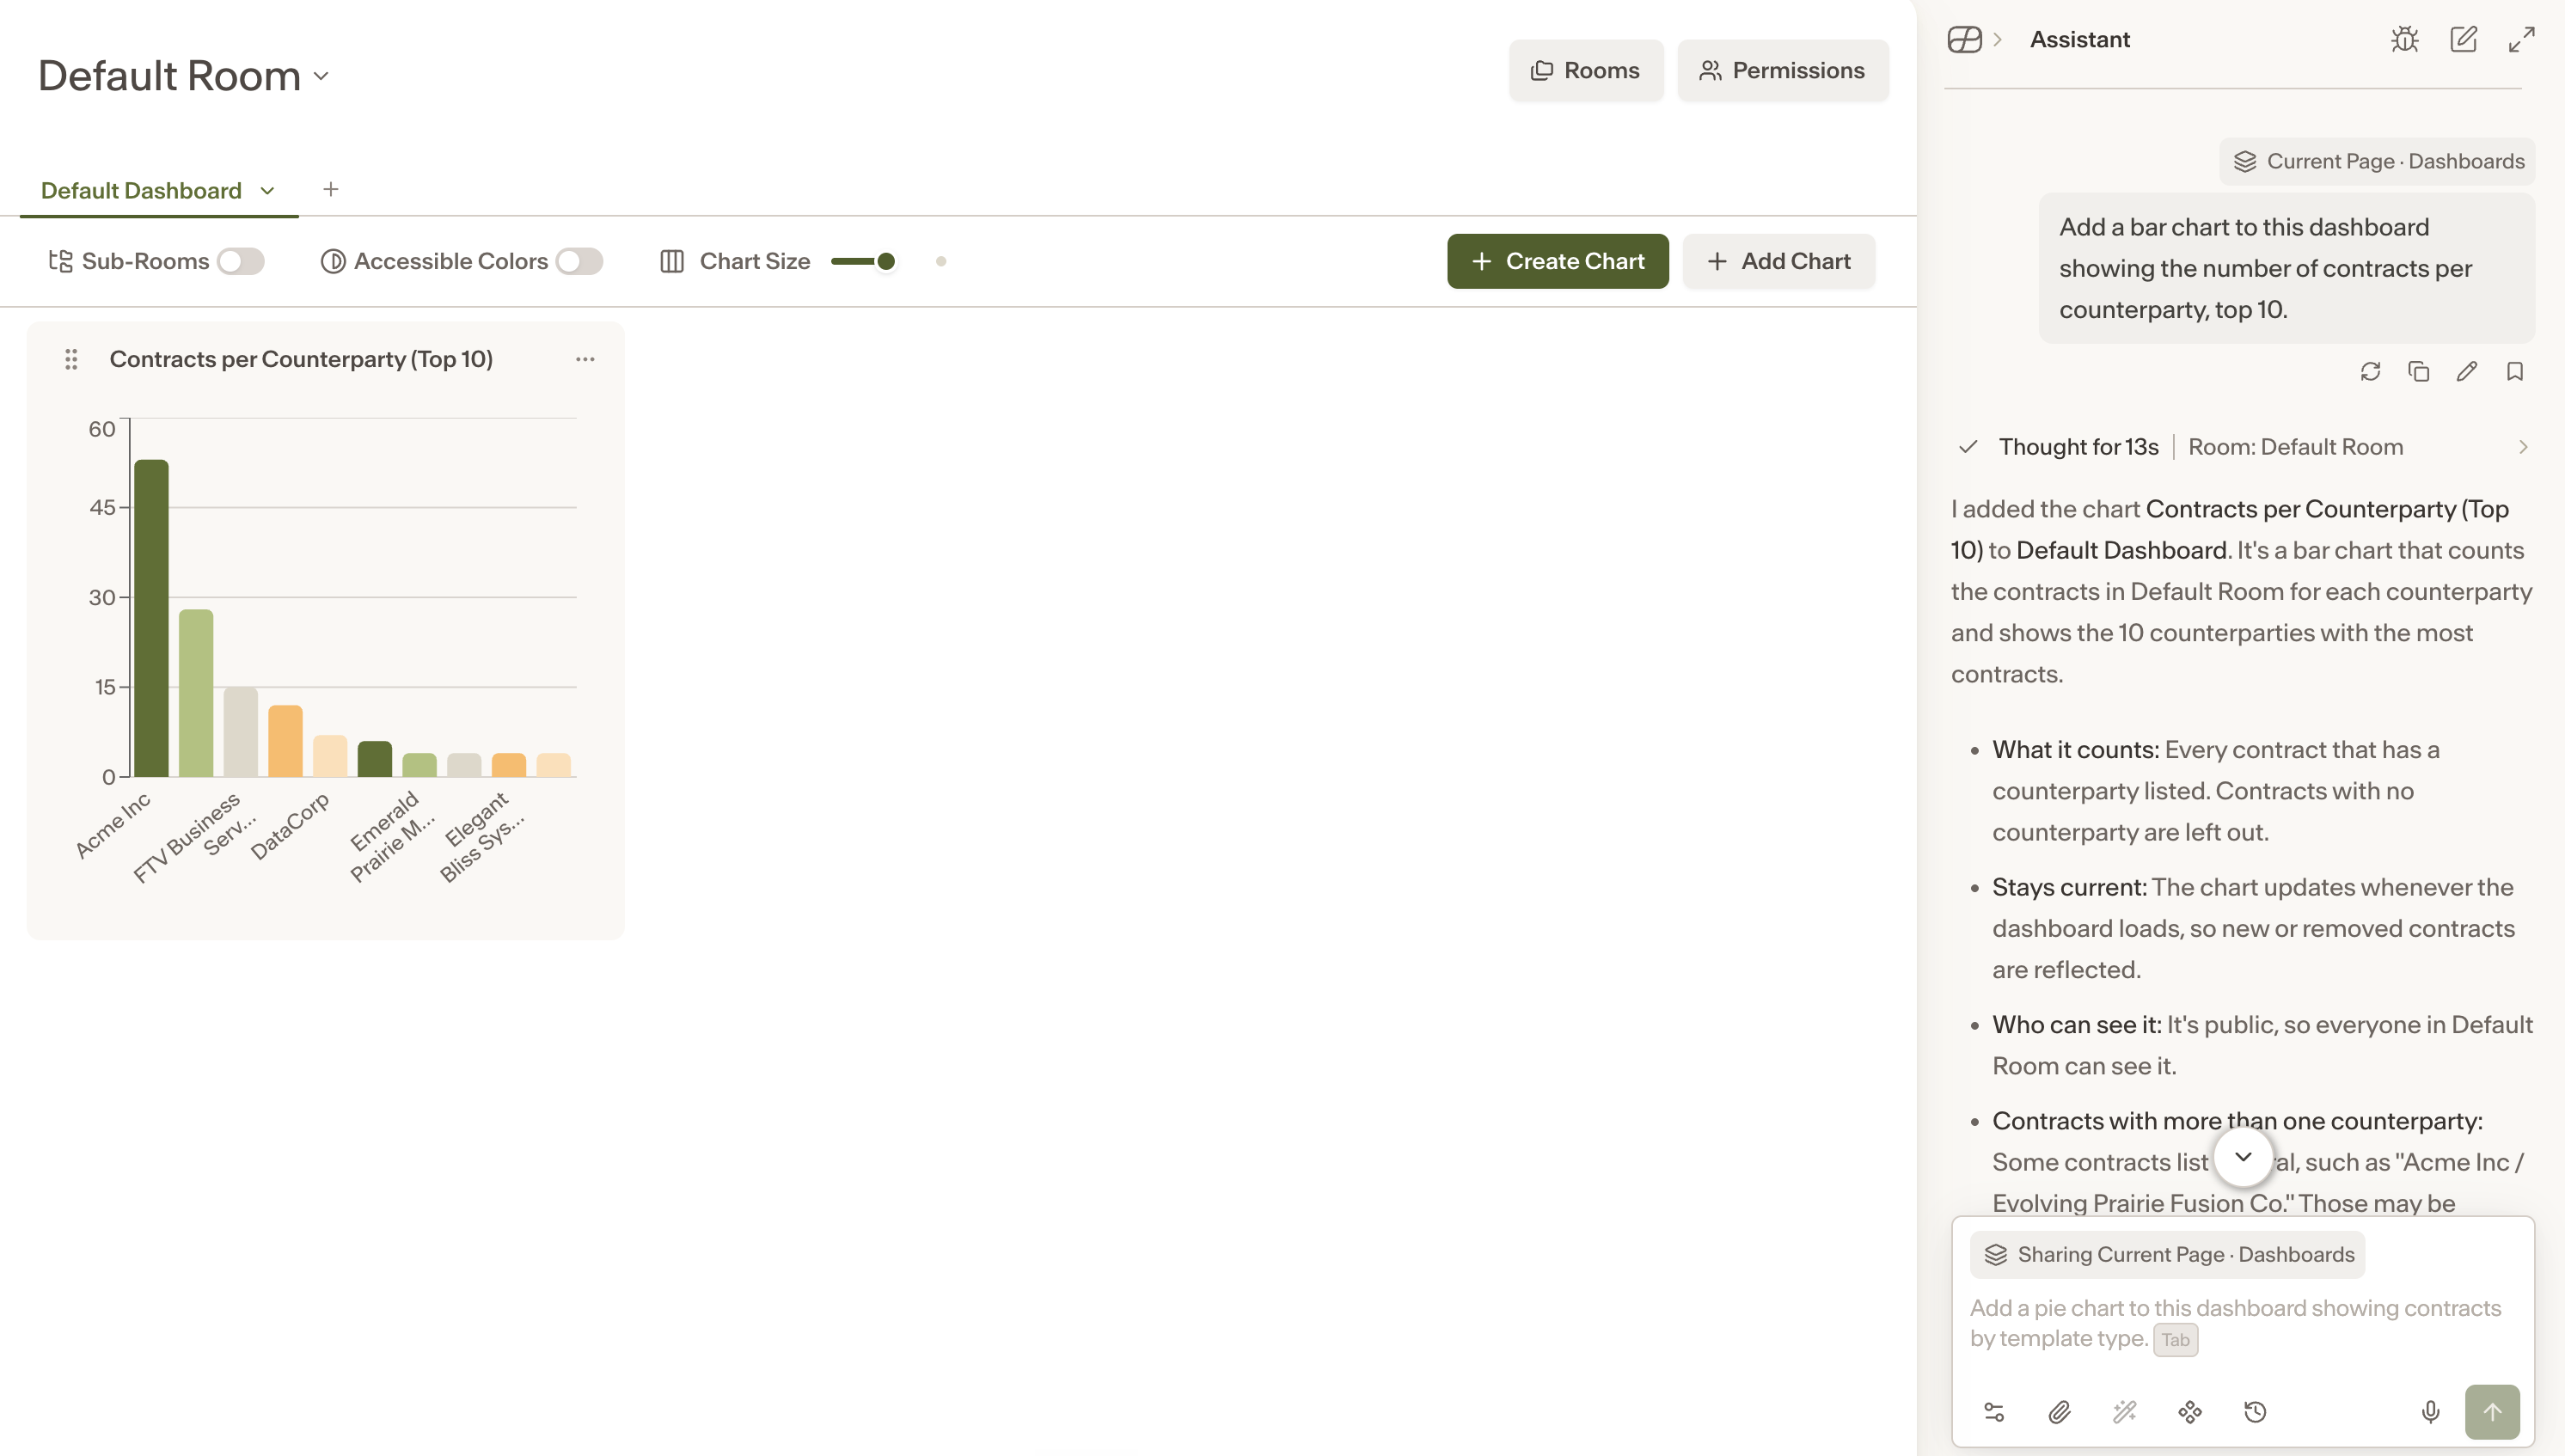
Ask Assistant to add the chart, including the chart type and the data you want to see.
Example:
Add a bar chart to this dashboard showing the number of contracts per counterparty, top 10.
Add a chart from another page
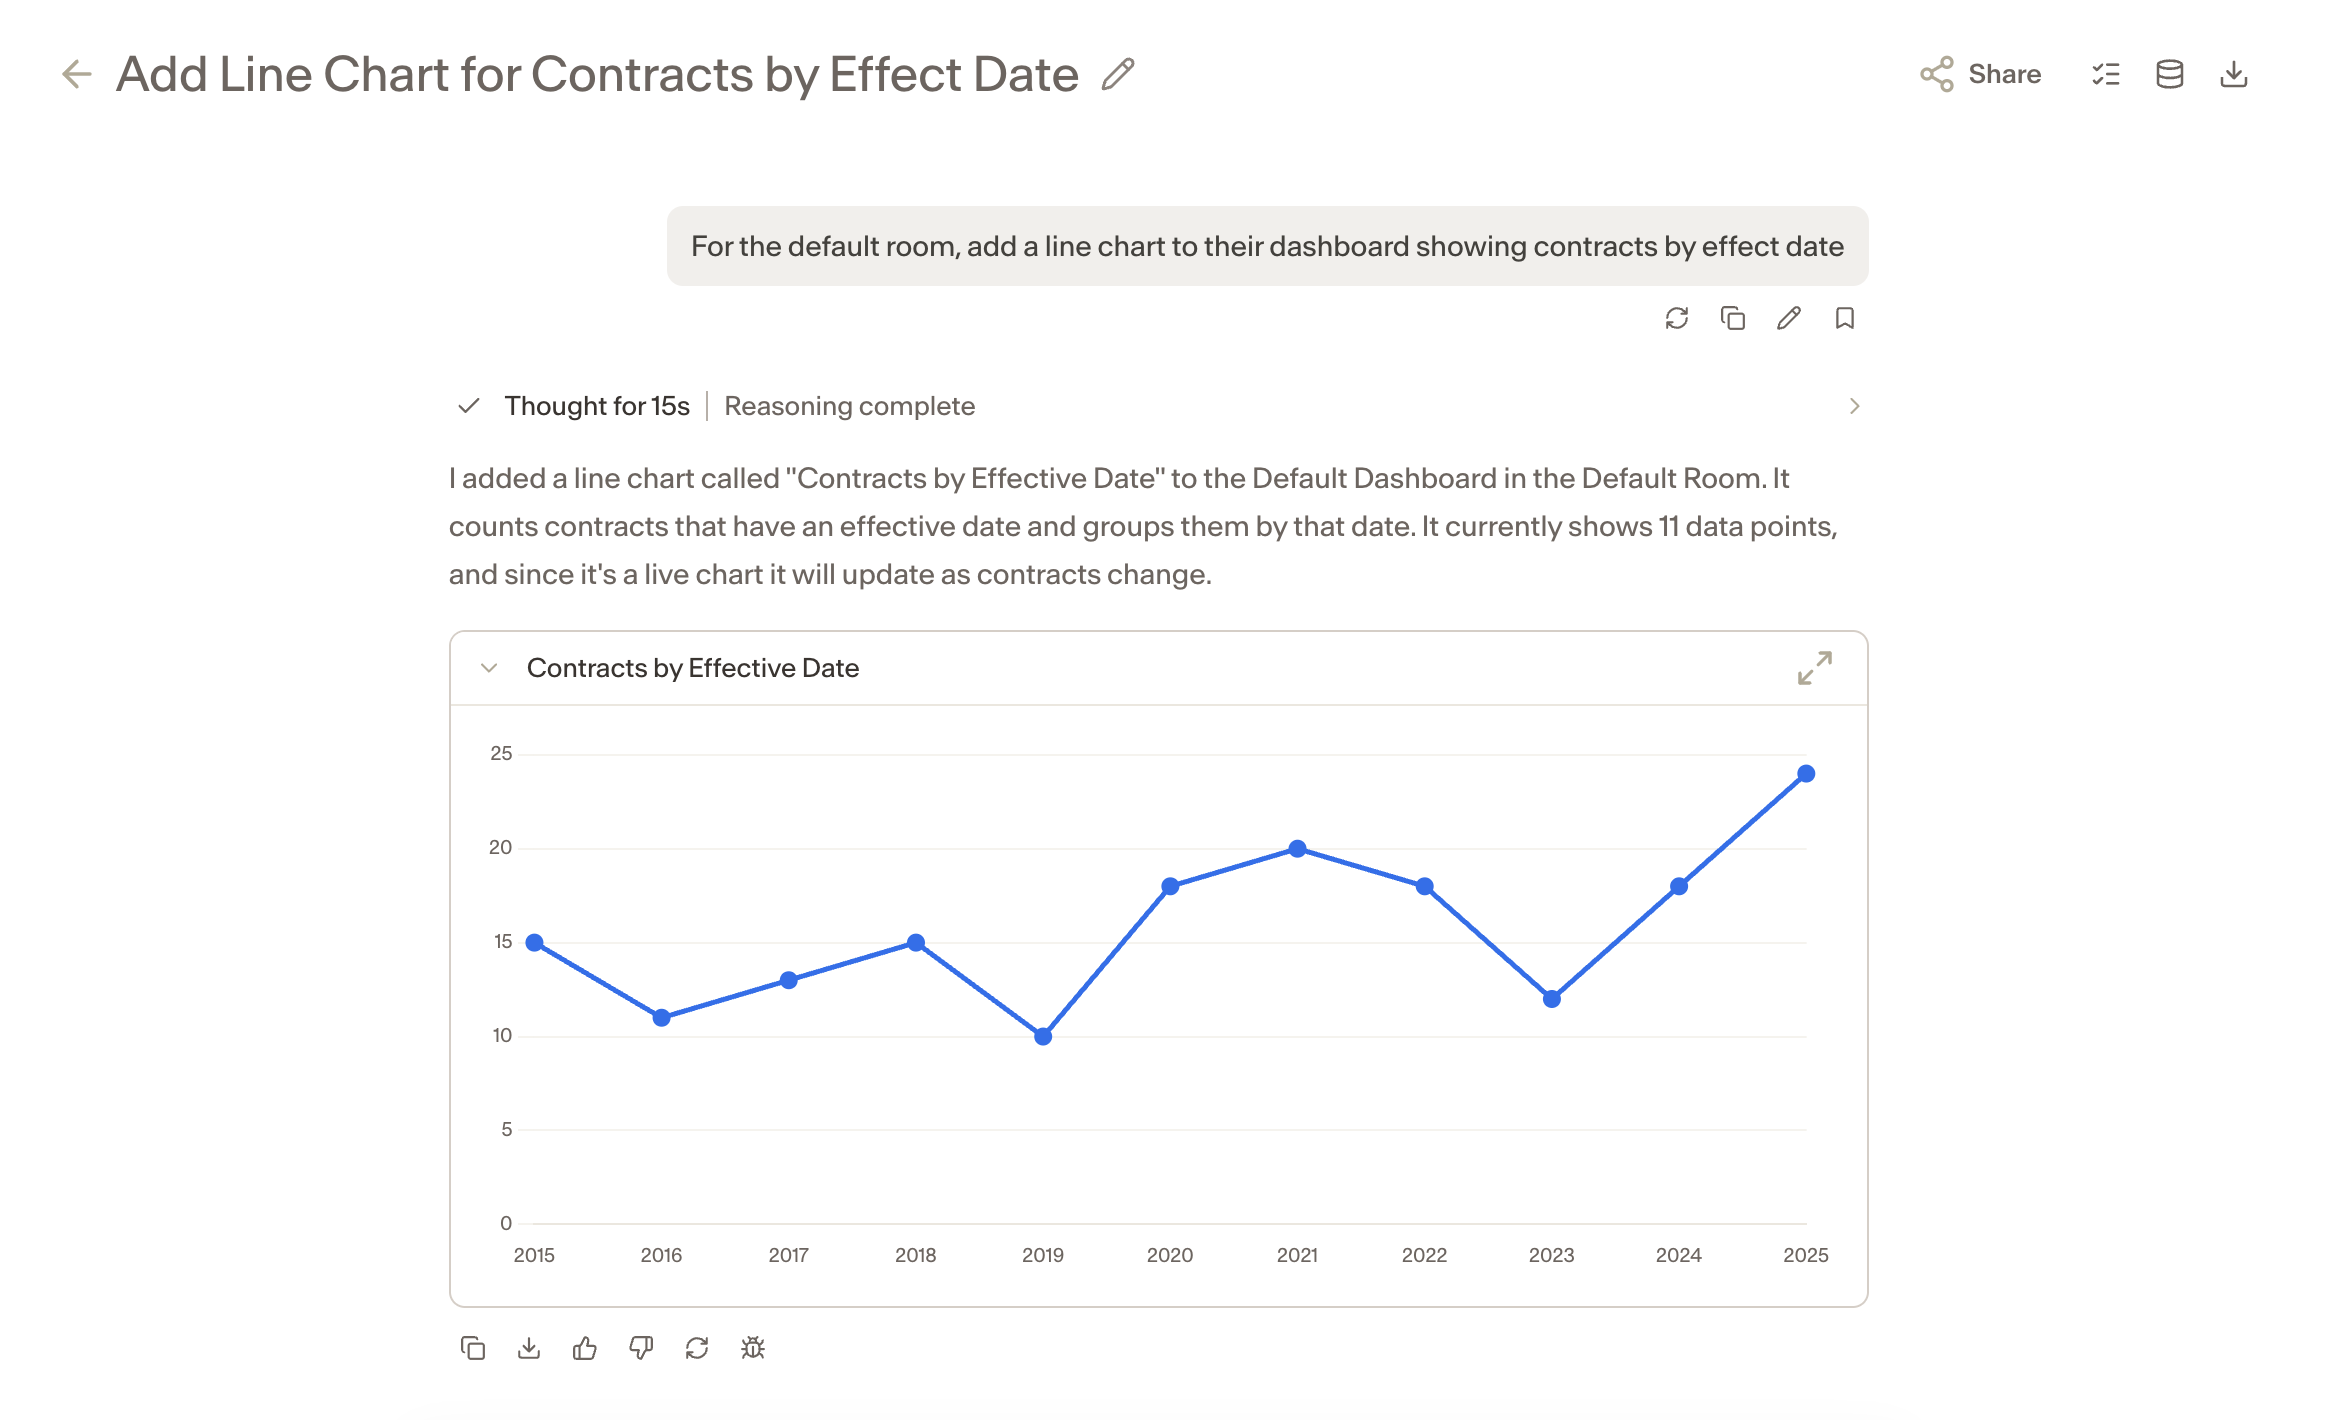
You don’t need to have the dashboard open. Name the Room and the dashboard in your prompt, and Assistant adds the chart for you.
Example:
For the [Room name] room, add a line chart to its dashboard showing contracts by effective date.
Build a chart from an AI Field
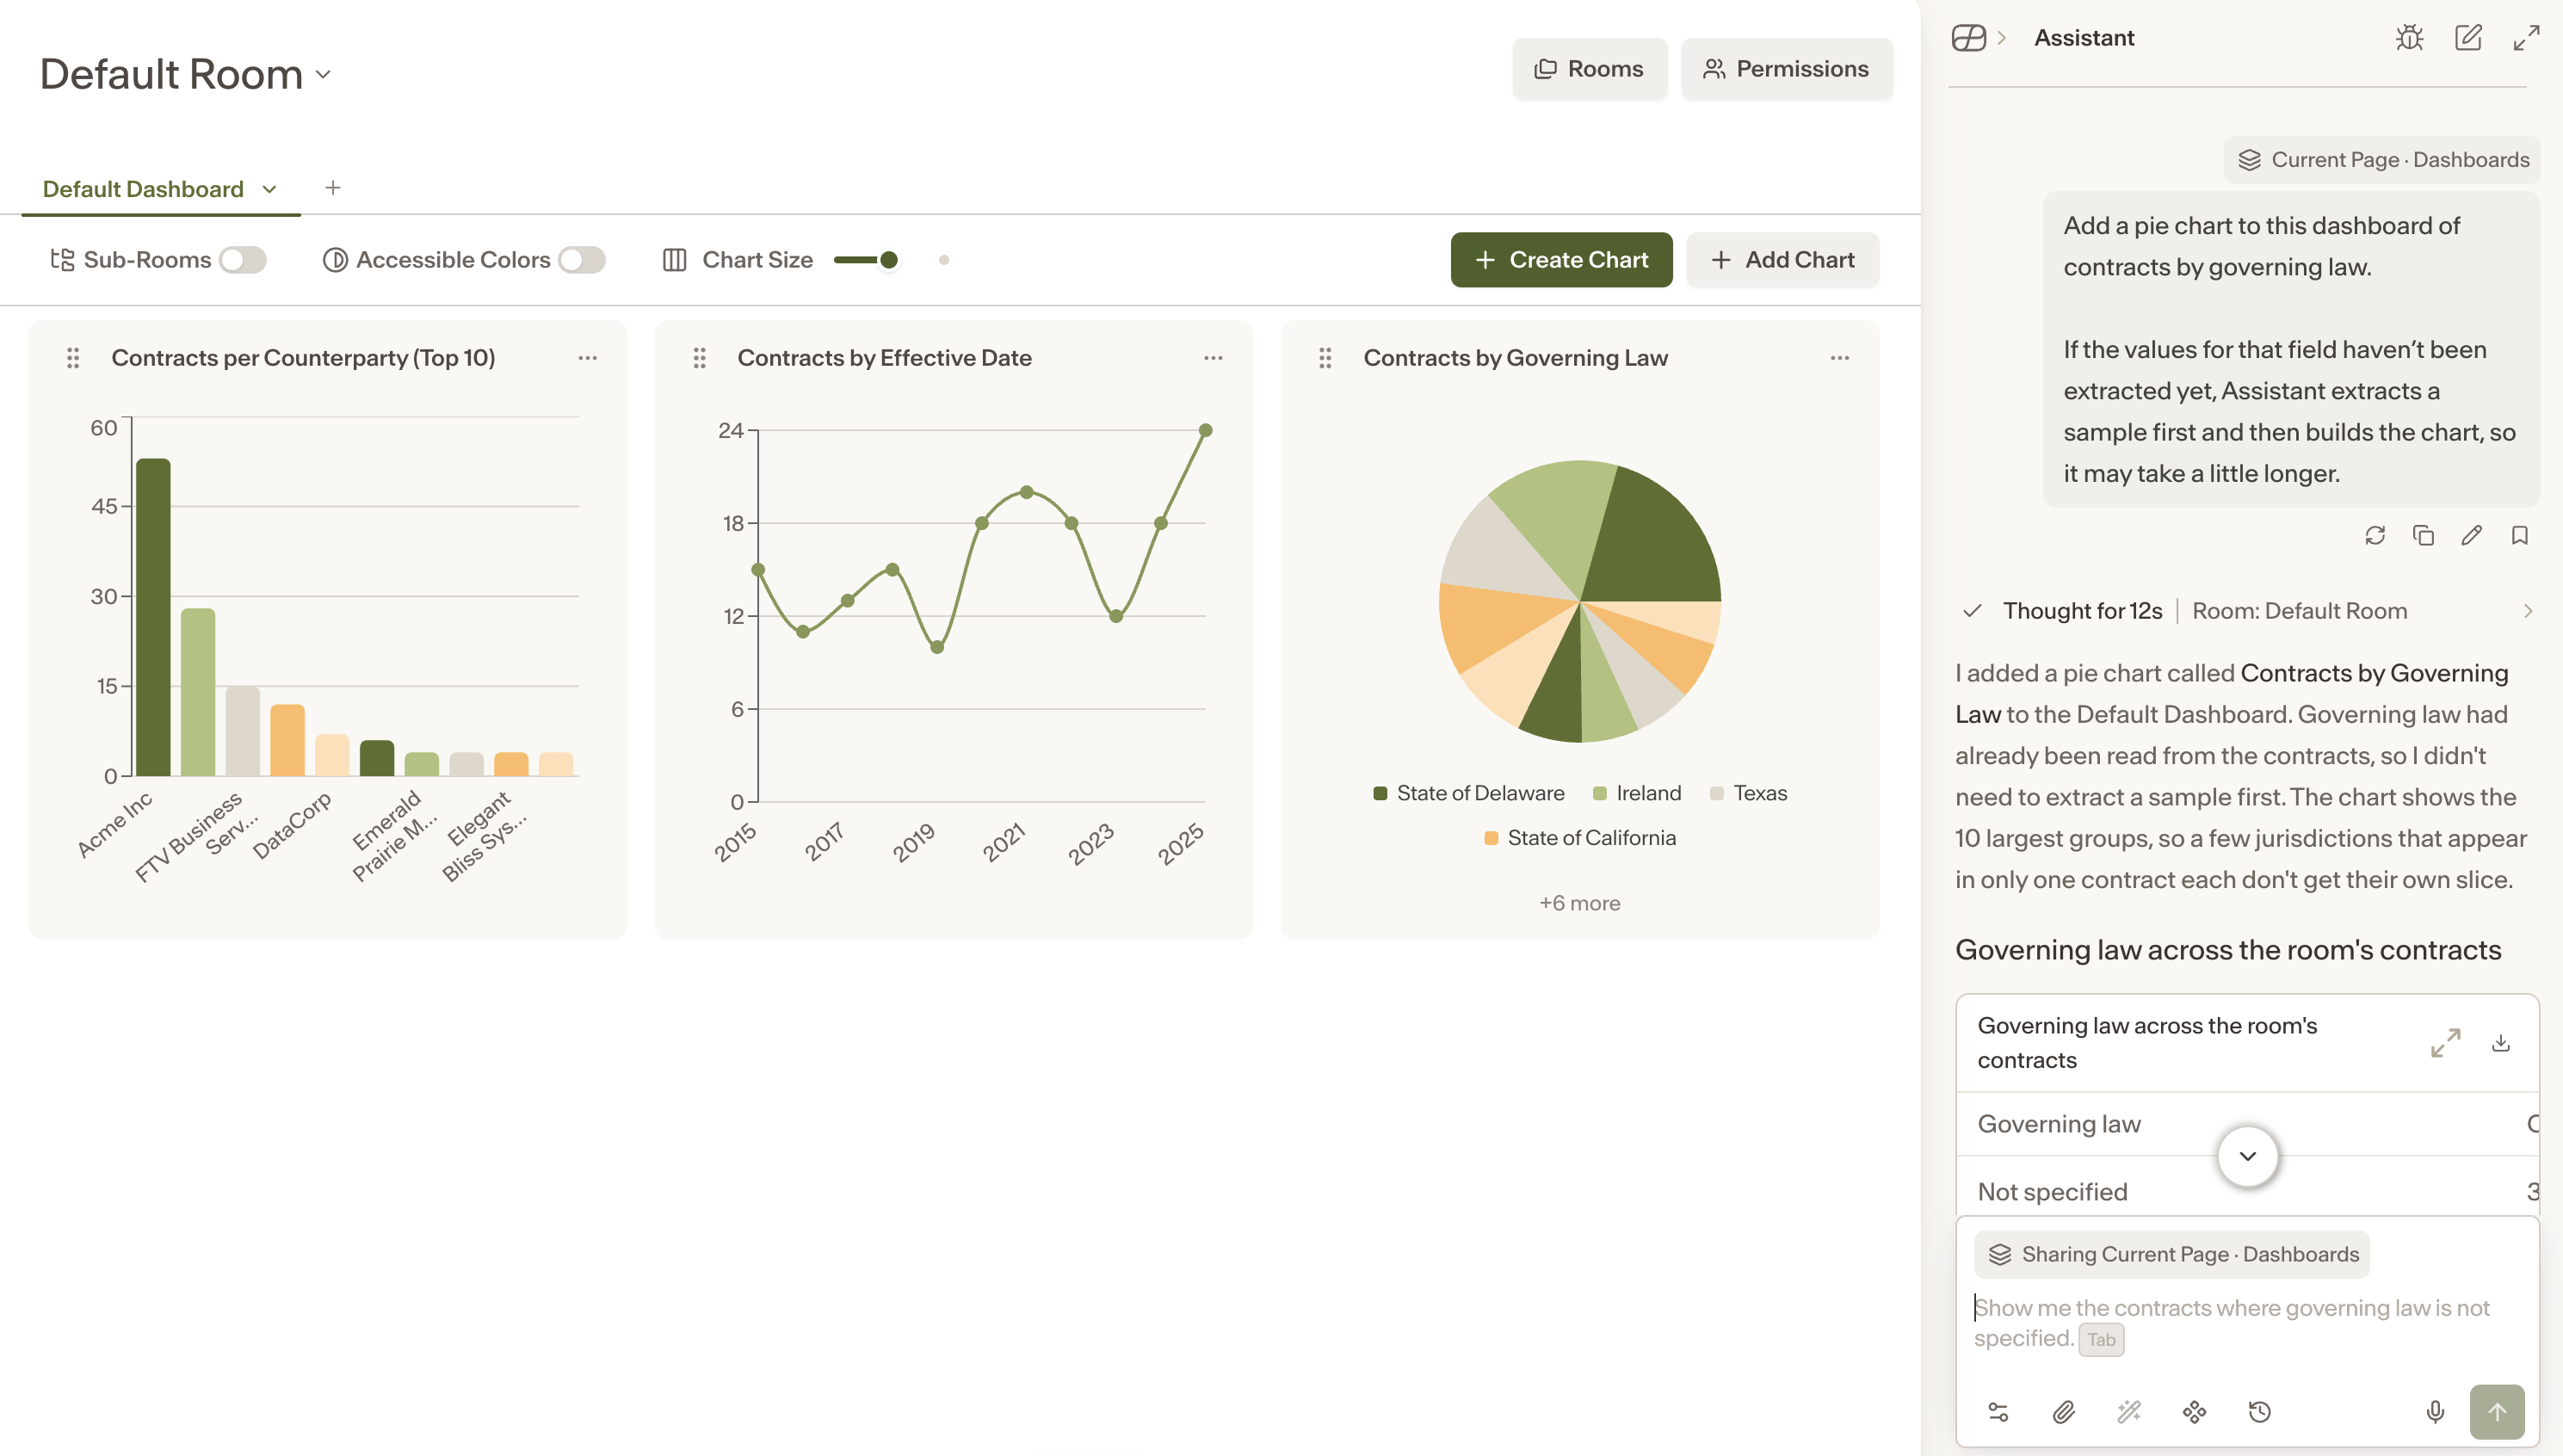
Charts can use your AI Fields, such as governing law.
Example:
Add a pie chart to this dashboard of contracts by governing law.
If the values for that field haven’t been extracted yet, Assistant extracts a sample first and then builds the chart, so it may take a little longer.
Tips for better results
Name the chart type, such as bar, line, or pie.
Say what to count and how to group it, for example “number of contracts per counterparty”.
Set a limit when there are many values, for example “top 10”.
Notes
If Assistant shows a chart but nothing appears on your dashboard, check that your prompt included “add”.
When you’re on a different page, include both the Room name and the dashboard name so Assistant knows where the chart goes.