Analytics Page
Last updated: August 31, 2026
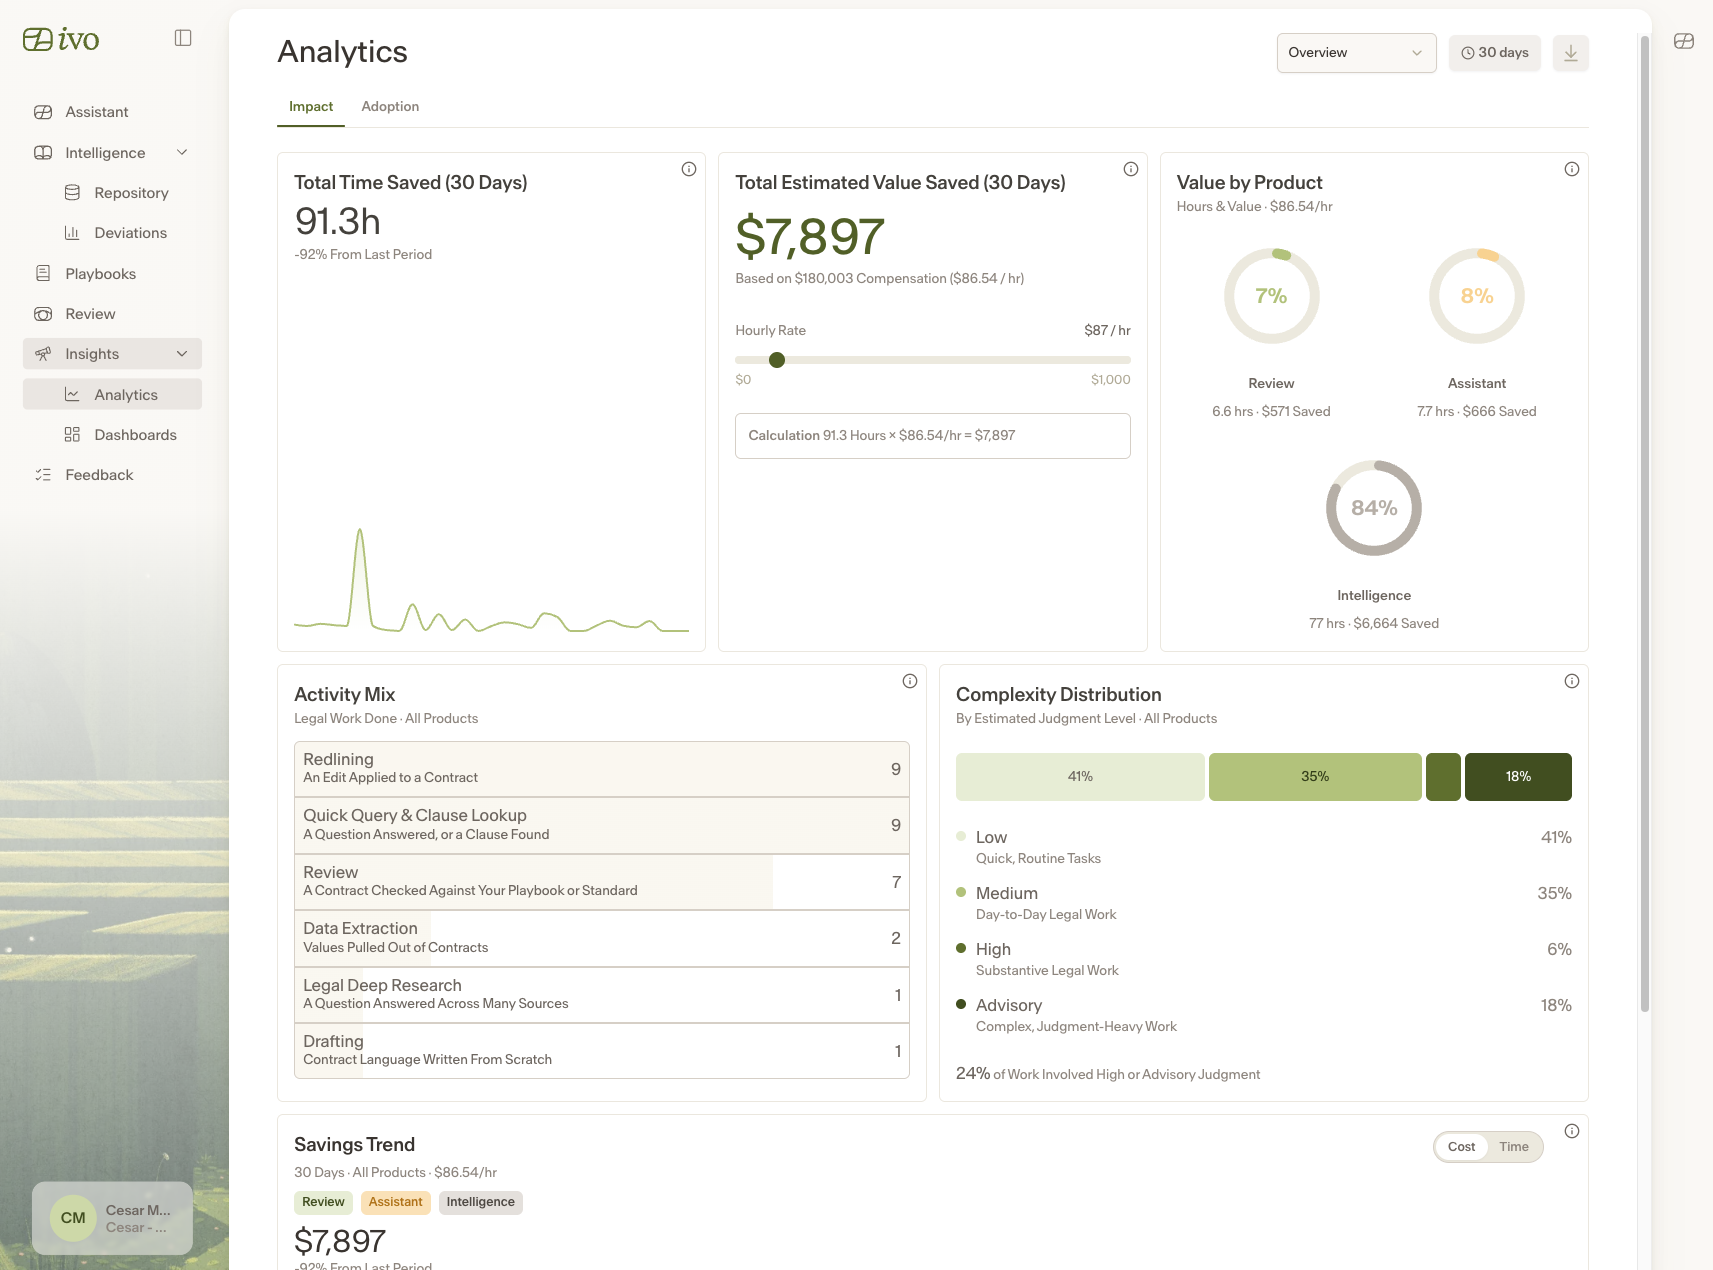
The Analytics page has been redesigned with a new look and expanded data. Existing analytics have been consolidated into the Impact tab, and a new Adoption tab provides deeper visibility into how your team is using Ivo.
Who can access Analytics
Workspace Admins can access both the Adoption and Impact tabs.
Review Admins can access the Impact tab and filter by user.
All other users can view their own analytics only.
Impact tab
The Impact tab consolidates the analytics previously available in the main Analytics page. Key additions include:
Activity log — a full log of all activities that occurred in the specified time period, with more detail available for each activity type.
Complexity chart — an indicator of the types of actions users have taken, from quick Assistant queries and short reviews through to more complex actions like deep research.
Adoption tab
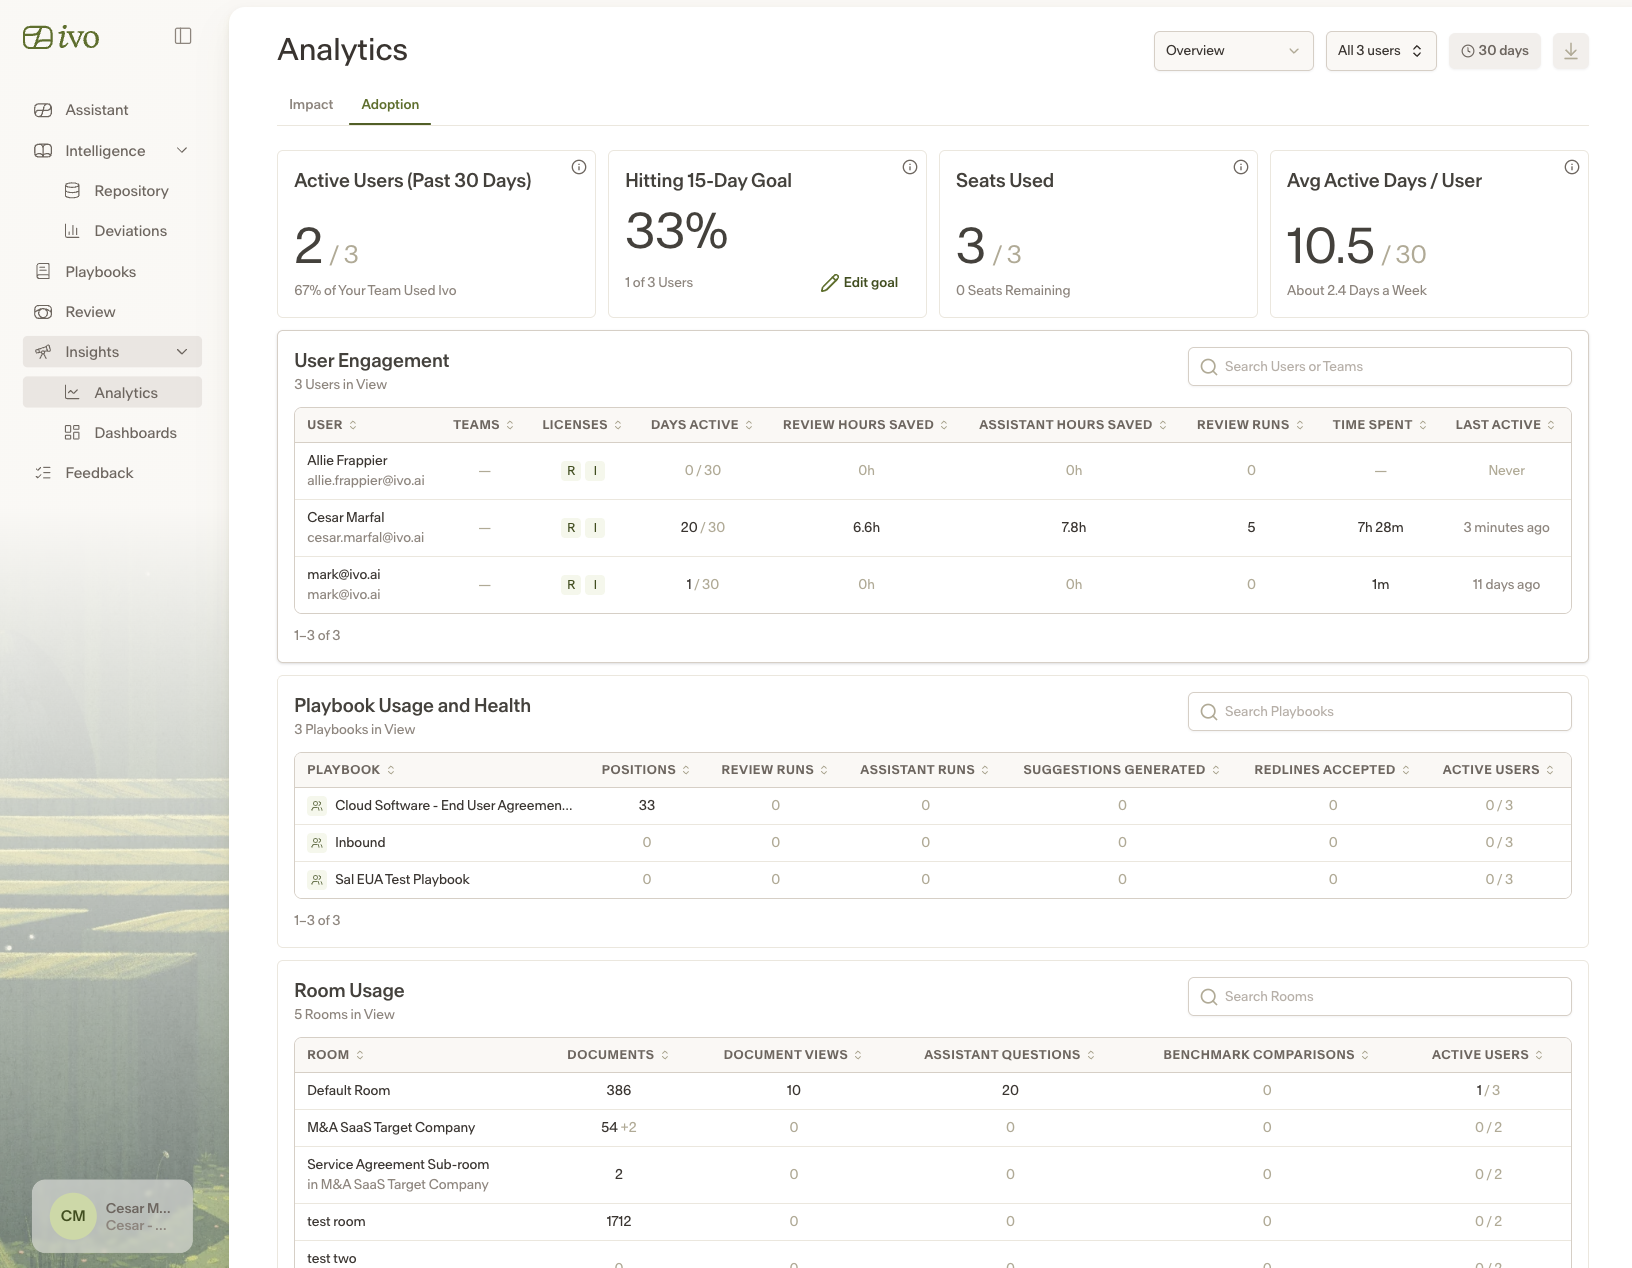
The Adoption tab is a new page that gives workspace admins visibility into how users are engaging with Ivo over time. It includes:
Active users — a rolling count of users active in the past X days, with the ability to set a goal and track progress.
Seat utilization — see how many seats are being actively used.
User engagement table — shows how active each user is, hours saved per tool, number of runs, last active time, and time spent on the platform.
Playbook health table — shows review runs, Assistant usage, suggestions generated, and users per playbook.
Room usage table — shows document counts, views, Assistant activity, benchmark comparisons, and user activity per room.
Updated exports
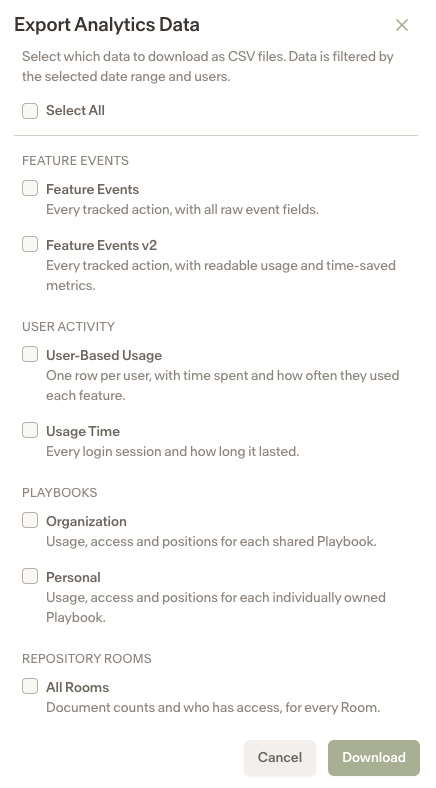
New export files are now available in Analytics:
Playbook exports — includes summary metrics, per-position data, and per-user activity for each playbook.
Room exports — includes user-level activity per room and sub-room, alongside a summary file with aggregated metrics.
FeatureEventsV2 — includes new fields such as redlines applied, translations, contract type, fallback positions, teams, licenses, and edited edits.