Benchmarks: Interactive Charts
Last updated: October 2, 2026
The Benchmarks charts in Review now let you dig deeper into your benchmark data without leaving the page. You can click into any bar or node to explore what it represents, see the contracts behind it, and navigate directly to those contracts in Repository.
What you can do
Click on a bar or node — select any bar or node in the chart to see more detailed information about what that category represents, including a breakdown of the values extracted from your contracts.
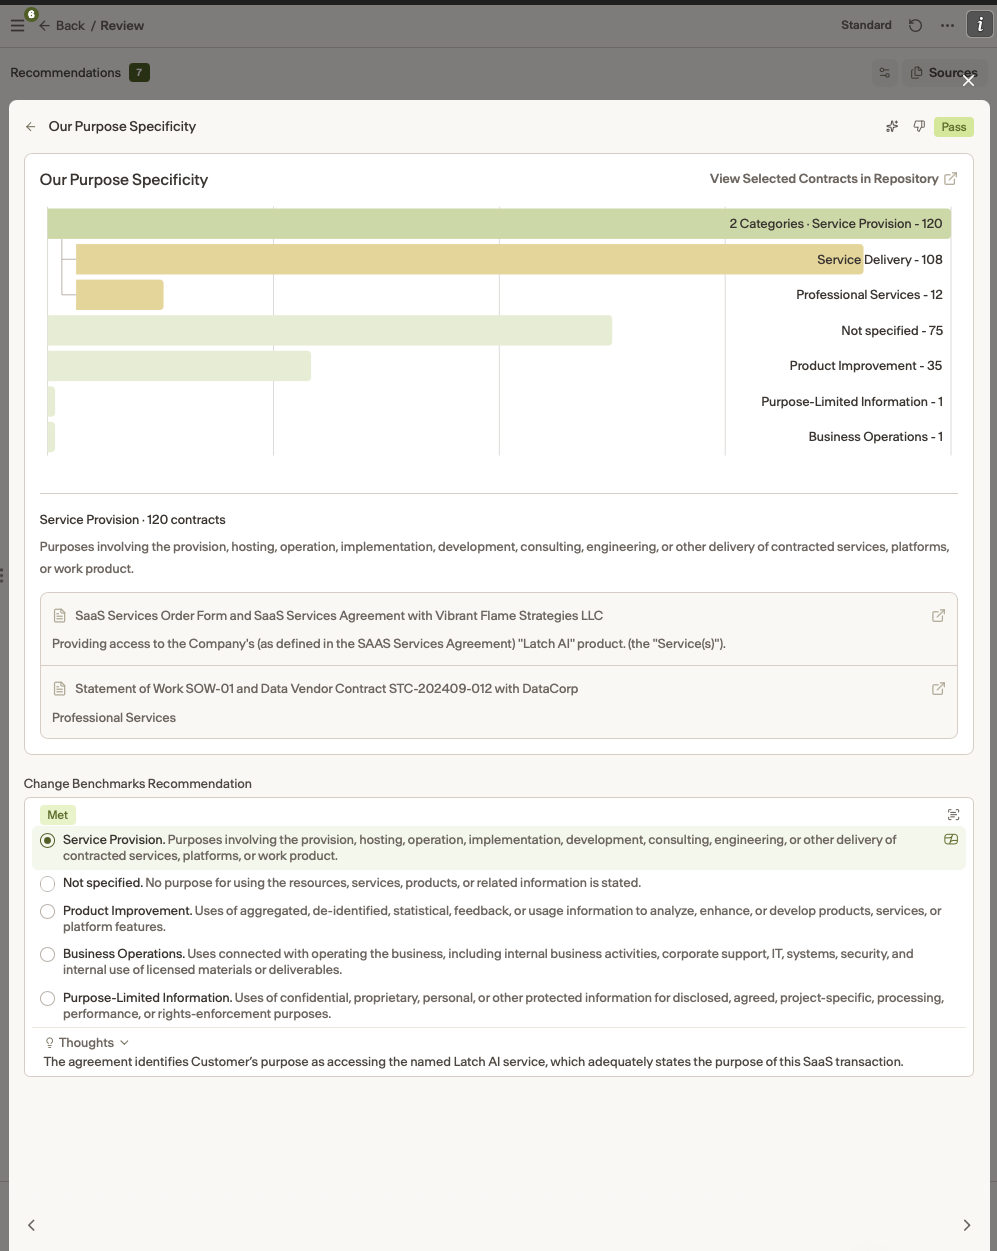
View example contracts — after selecting a bar or node, you can see the specific contracts that make up that category and the values Ivo extracted from them.
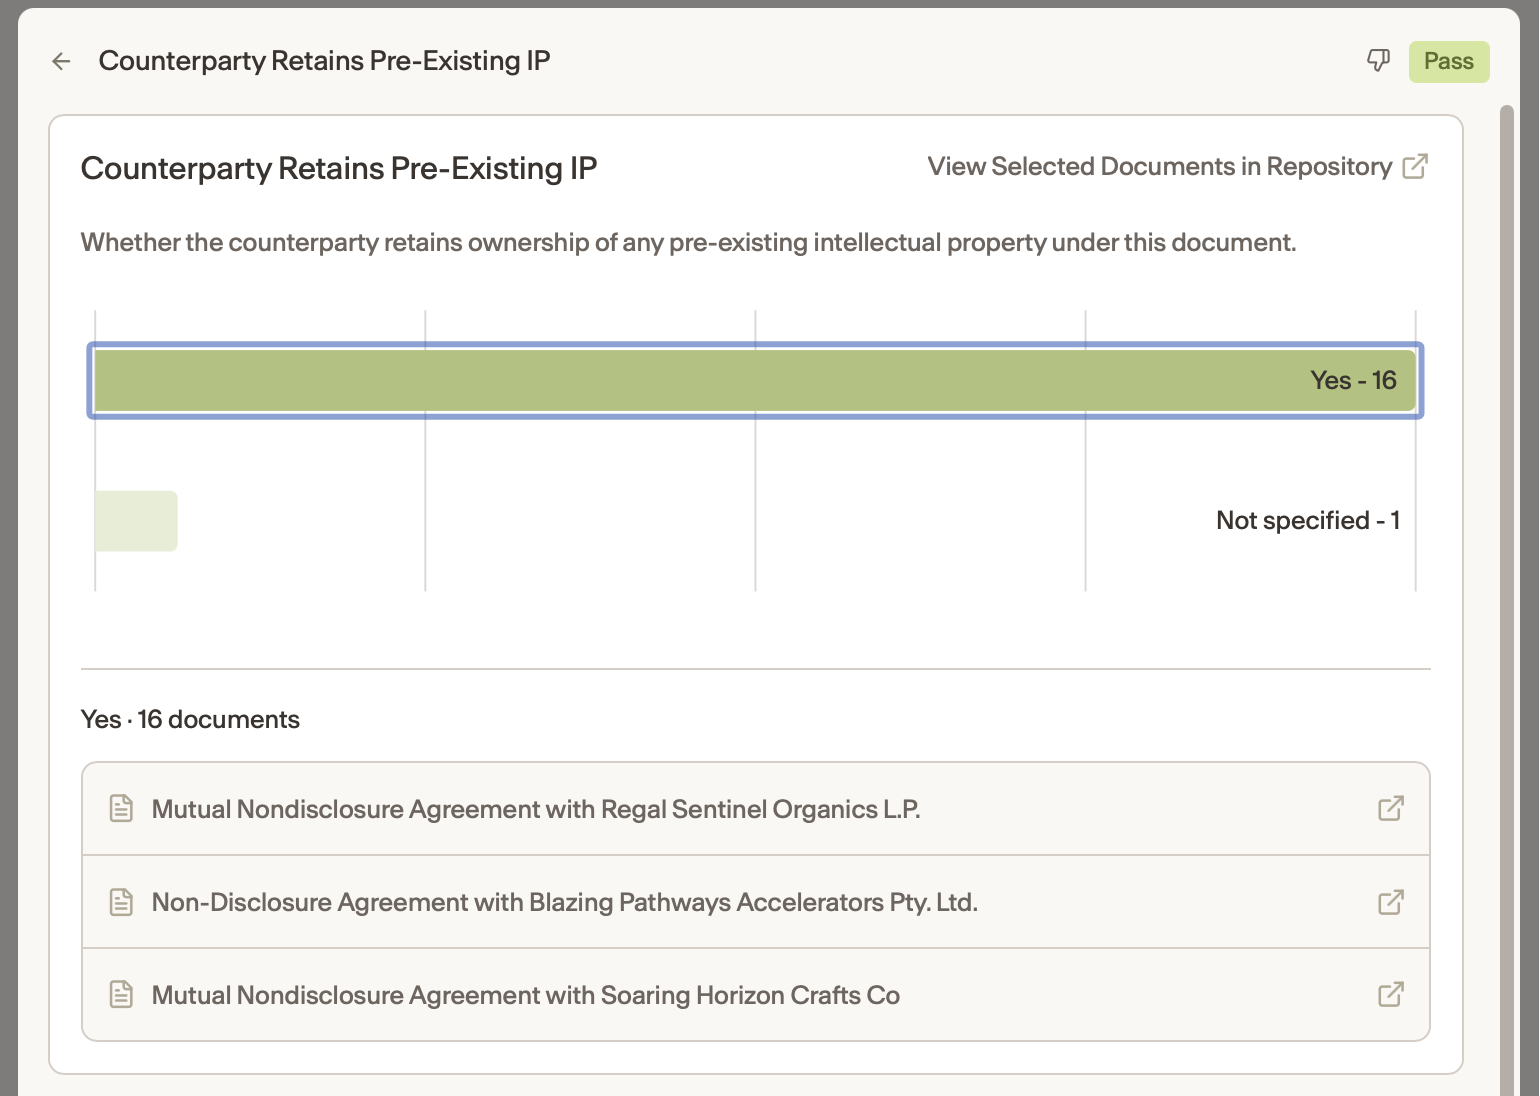
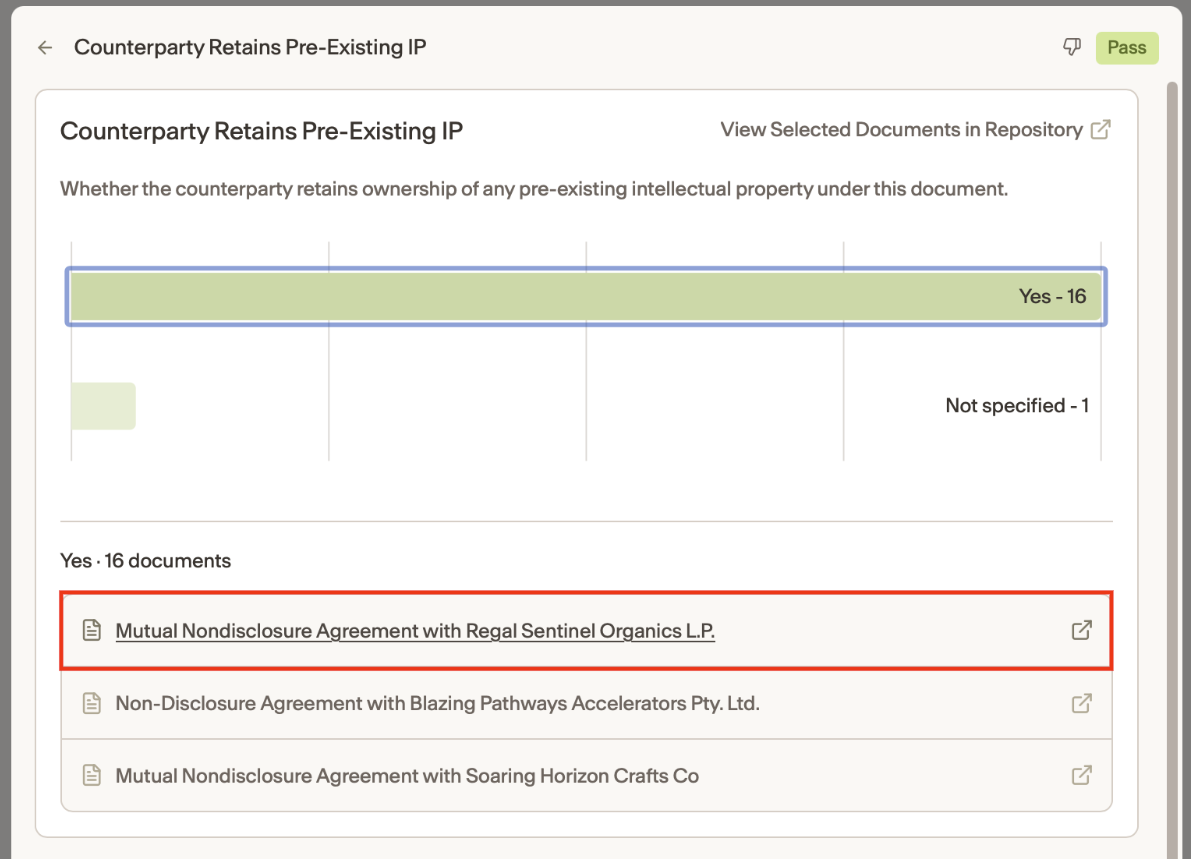
Navigate to contracts in Repository — click the link on an example contract to open it directly in Repository, or click the link to view all contracts in that category at once.
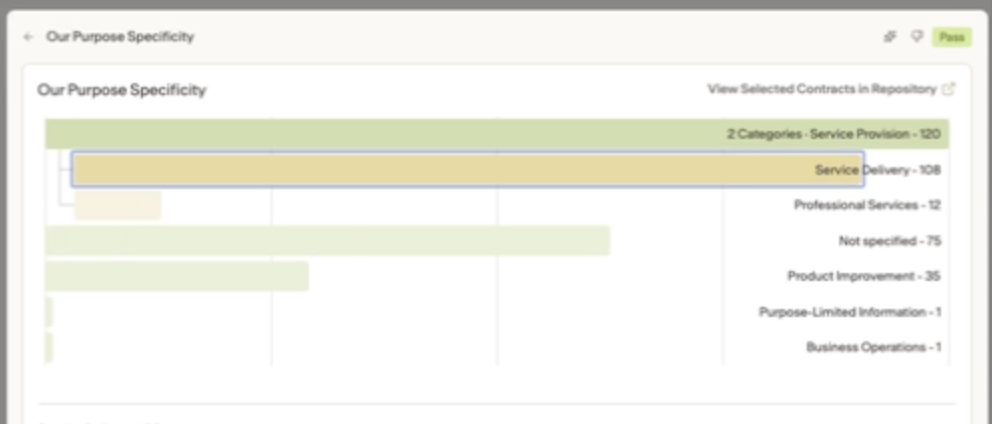
Expand subcategories — for categories that contain subcategories, you can expand them to see a more granular breakdown of what makes up that group.
Notes
This feature is available in Review.
Access to contracts from the Benchmarks charts is gated by your existing Repository permissions.